|
|||||||||||||||||||||||||||||
|
|||||||||||||||||||||||||||||
|
The Top 200 Canadian Stocks for 2014 Finding the right Christmas gift can be difficult and some people are particularly hard to shop for. The combination can, on occasion, make the holiday season feel like an exercise in passing the proverbial brown sweater back and forth. Investors suffer from a similar problem when looking for good stocks. But, in some ways, they have it even worse because they have to wait for months, if not years, before finding out whether their picks turn out to be duds or stars. To help you navigate through the market to find the very best prospects, we're pleased to present you with the 10th annual MoneySense Top 200 guide to Canadian stocks. It's packed full of information on the best companies in Canada. We're thrilled to report our efforts have paid off handsomely since last time. Our All-Star stocks, which combine the best growth and value characteristics, gained an average of 55.0% since last year. By way of comparison the Canadian market, as represented by the S&P/TSX Composite ETF (XIC), gained 7.2% over the same period. (Neither figure includes dividends.) Such superb short-term results are one thing, but the All-Stars have shined over the long term too. If you had bought equal amounts of the All-Stars and rolled your gains into the new stocks each year, you'd have enjoyed 19.1% average annual returns over the last nine years. On the other hand, the S&P/TSX Composite (XIC) advanced 4.8% annually over the same period, which means the All-Stars beat the market by an average of 14.3 percentage points a year. 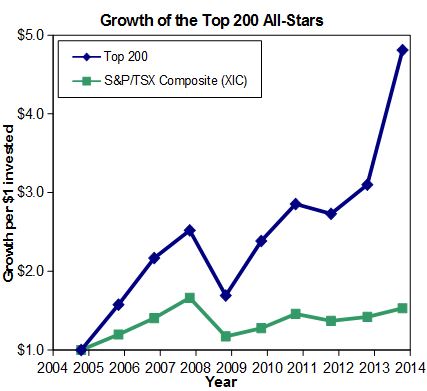 As you might imagine, we're very pleased with our performance record. Just take a look at the charts above, which translate the percentages into more easily understandable dollar terms. If you had split $100,000 equally among the original All-Stars nine years ago, then sold them and moved your gains into the new stocks each year, your portfolio would now be worth approximately $481,000 - almost five times your original investment. Again, that doesn't include dividends, but they could have been used to buy more than a few presents over the years. We'll be toasting our success this holiday season, but remember stock-picking comes with more than a dash of risk and uncertainty. Our picks underperformed the market twice in the last nine years and we fully expect to encounter difficult periods in the future. Also, some stocks that may look good today could go on to perform poorly. We hope to avoid such situations but we're not always that lucky. That's why it's important to know what you're getting into before diving into the stock market. Those starting out should read The MoneySense Guide to Investing in Stocks, downloadable as an ebook. It explains the basics of stock-picking and more advanced topics. Still, we hope our track record whets your appetite for this year's Top 200. As in prior years, we scrutinize our 200 largest public companies and grade each on its investment merit. Pages 40 to 47 provide an easy-to-use scorecard stuffed with just the sort of information investors love. The Top 200 provides a logical, consistent, and easy-to-use approach to uncovering the best stocks. Like the penny-pinching Ebenezer Scrooge, our method isn't swayed by feelings or fancies. Nor do we rely on gut instincts or exuberant expectations of what the future might bring. Instead, we focus on the numbers and our opinions about each company don't enter into it. We begin with the largest 200 companies in Canada, based on revenues, using data from Bloomberg. We then grade each stock for its investment appeal based on two measures. First we size up its merit as a value investment, then its attractiveness as a growth investment. (Value investors like to buy lots of assets for low prices while growth investors prefer firms with good sales and earnings growth.) Our tests use a set of complex calculations, but in the end we reduce everything about a stock to two simple grades: one for its growth potential and one for its value appeal. The grades work like they did when you were in school. Top stocks are awarded As. Solid firms get by with Bs or Cs. Those that don't quite measure up are sent home with a D or an F. We are attracted to stocks with good grades while those at the bottom should prompt serious second thoughts. To get into the All-Star list, a stock must achieve at least one A and one B on the value and growth tests. Only 11 made it into this elite group this year. But before we discuss the new All-Stars, here's how we graded each stock. Aiming for Value Value investors love bargains and seek firms selling at low prices compared to various measures of financial merit. That's why we start by examining price-to-book-value ratios (P/B). This number compares a firm's market value to how much money could be raised by selling off its assets (at its balance-sheet values) and paying off its debts. Low P/B ratios provide an indication you're not paying much more for a stock than its parts are worth. To get top marks for value, a stock must possess a low price-to-book-value ratio compared to the market overall and to competitors. We also track price-to-tangible-book-value ratios. Tangible book value is like regular book value, but ignores intangible assets like goodwill. It's an even stingier estimate of how much a company would be worth to a Scrooge-like investor intent on closing it down and selling it for scrap. To test for safety, we investigate each company's bottom line. Since companies rarely go bust while profits are rolling in, we award higher scores to firms with positive price-to-earnings ratios (based on earnings over the past 12 months). We also reward a company if industry analysts expect it to have a positive P/E in the next 12 months (this is known as the forward P/E ratio). We prefer stocks that pay dividends. Not only do dividends provide a nice income stream that can be used to fund lavish holiday feasts, but dividend stocks have a history of substantially outperforming miserly firms that keep all the money to themselves. Low prices are one thing but it's also useful to keep an eye out for companies that have loaded up on debt. We want to steer clear of corporate spendthrifts living high off the hog on credit. Instead, we award better grades to firms with low leverage ratios (defined as the ratio of assets to stockholder's equity) compared to their peers. Only 21 stocks managed to pass all of the value tests this year to earn themselves an A.
Grading for Growth Growth investors love, well, growth. That's why we start by awarding more marks to firms with solid earnings-per-share and sales-per-share growth over the last three years. We also track each firm's growth in total assets over the last year to make sure it is not overextending itself. As great as growth is, it is also important to make sure they're generating good returns. That's why we scrutinize each stock's return on equity. This measures how much a firm is earning compared to the amount shareholders have invested. It is a critically important indicator of business quality and we give high marks to stocks with healthy returns on equity compared to others in their industry. We also like it when the market takes note of a company's progress. Stocks with strong price momentum tend to continue to outperform, which is why we give higher marks to stocks with solid returns over the last year. Finally, we weigh up each stock's price-to-sales ratio which measures its price in comparison to its sales. Firms with sky-high price-to-sales ratios have usually gotten ahead of themselves and have a nasty habit of disappointing investors. We give extra marks to stocks with low-to-moderate ratios. Each stock's final growth grade is determined by combining these considerations, and only 20 earned an A this year.
All-Star Stocks As mentioned previously, only 11 stocks earned at least an A and a B on our value and growth tests to make it into the All-Star list. They represent the most interesting candidates the market has to offer this year. As it happens, two of last year's All-Stars made the list again. The veterans are: E-L Financial (ELF) and Newalta (NAL). E-L Financial is particularly interesting because it recently sold its property and casualty insurance division for a pretty penny to a U.S. firm. While it's not entirely clear what the company will do with the mountain of cash, management mentioned global equities as a possibility. The new additions this year are: Aecon Group (ARE), Canam Group (CAM), Cervus Equipment (CVL), Ensign Energy Services (ESI), Genworth MI Canada (MIC), Husky Energy (HSE), Martinrea International (MRE), Sun Life Financial (SLF), and WestJet Airlines (WJA).
Special congratulations go to Aecon Group for achieving a coveted double-A rating this year. The Toronto-based company runs one of the country's largest construction and infrastructure development businesses. Its stock trades at 11 times earnings, pays a 2.2% dividend yield, and sports a return on equity of almost 15%. Before rushing out to buy any stock, do your due diligence. Make sure its situation hasn't changed in some important way. Read the latest press releases and regulatory filings. Scan newspaper stories to make sure you know about any important developments and breaking news. You should also keep an eye out for stocks that trade infrequently and take care when trading them. If you take these important steps, you'll be more comfortable with your investments, which will increase your chances of enjoying a very merry Christmas next year. First published in the December/January 2014 edition of MoneySense magazine. Added:
|
|||||||||||||||||||||||||||||
| |||||||||||||||||||||||||||||
| Disclaimers: Consult with a qualified investment adviser before trading. Past performance is a poor indicator of future performance. The information on this site, and in its related newsletters, is not intended to be, nor does it constitute, financial advice or recommendations. The information on this site is in no way guaranteed for completeness, accuracy or in any other way. More... | |||||||||||||||||||||||||||||